####| echo: false
import matplotlib.pyplot as plt
import numpy as np
import seaborn as sns
# Sample visualization code
np.random.seed(42)
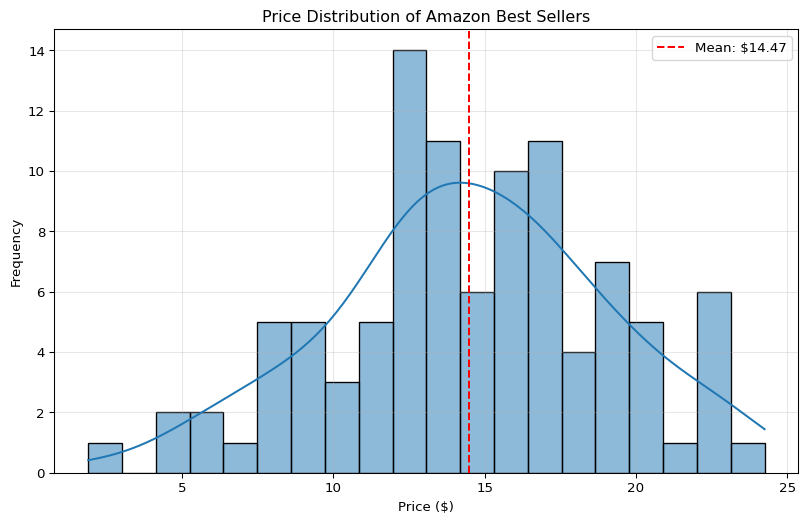
prices = np.random.normal(14.99, 5, 100) # Simulated price data
plt.figure(figsize=(10, 6))
sns.histplot(prices, bins=20, kde=True)
plt.title('Price Distribution of Amazon Best Sellers')
plt.xlabel('Price ($)')
plt.ylabel('Frequency')
plt.axvline(prices.mean(), color='red', linestyle='--', label=f'Mean: ${prices.mean():.2f}')
plt.legend()
plt.grid(alpha=0.3)
plt.show()